


Document Actions
gvSIG-Desktop 1.10. User Manual
- Alphanumeric data
Alphanumeric data
File
Introduction
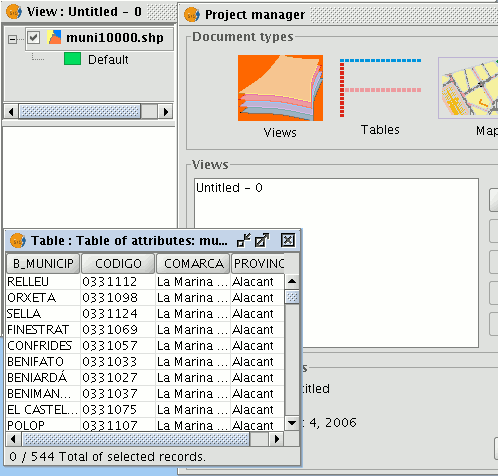
Tables are documents which contain alphanumeric information. Tables are made up of rows or records (which represent each of the elements in the data base) and columns or fields (which define the different attributes of each element).
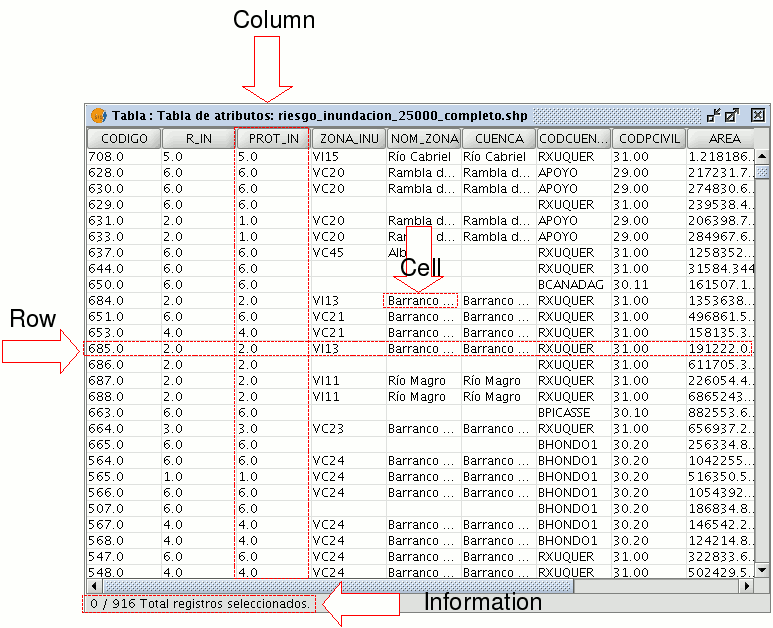
Row or record: Used to represent the different elements in the table.
Column or field: The types of attributes which define each element.
Cell: A cell is the intersection of a record and a field. A cell is the minimum working element and may contain information.
Record information: This provides information about the total number of elements (records) contained in the table.
All the vector information layers have their own “Table of attributes”. Each graphic element in a particular layer has its corresponding record in the “Table of attributes”.
To select elements in the table, left click on them. Use the “Control” and “Shift” (CAPS) keys to select more than one record.
Adding a Table
You can load a table in gvSIG in two ways:
- From the “Project manager”
- From the “View”
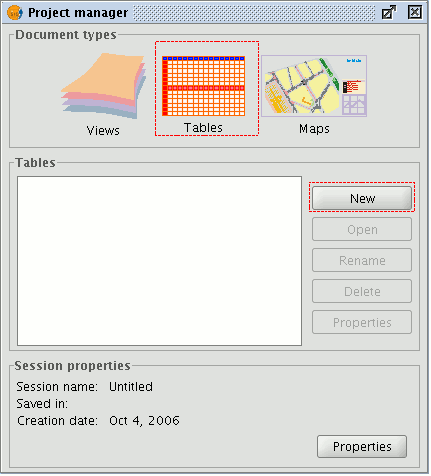
Select “Tables” as the document type from the “Project manager” and click on “New”. A dialogue box will open in which you can add the table.
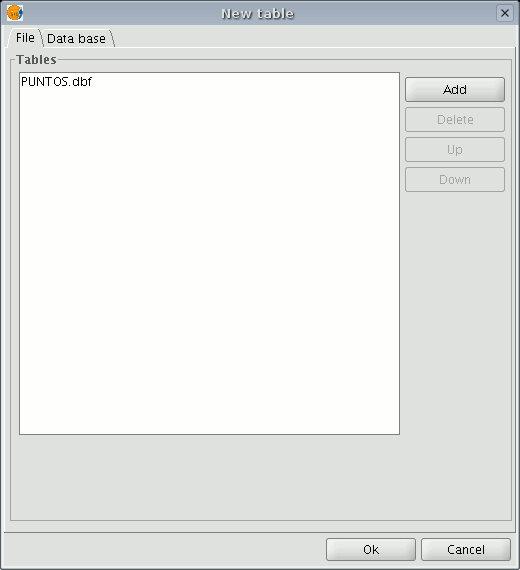
When you click on the “Add” button, a browser window will open.

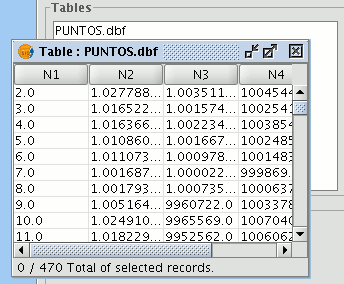
Specify the type of file you wish to load in gvSIG in “Files of Type”. When you have located the file that contains the table, select it so that it is added to the “File name” text box and click on “Open”. You will automatically be returned to the "Add table" dialogue. If you wish to add more than one table, click on "Add" again and repeat the process. When you have finished, click on “Ok”. The table will then be displayed. It will also appear in the “Project manager” text box.
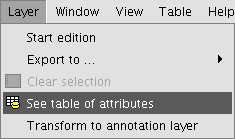
Click on the "See table of attributes" button from the display window of a view with at least one active layer, i.e. a layer that is selected in the ToC,

or go to the "Layer" menu and then select the "See table of attributes" option.
The table will automatically be added to the project.
If you minimise the view, go back to the "Project manager" and select "Tables" as the document type, you will see that the table displayed in the view appears in the text box.
Table properties
You can access “Table properties” from the “Project manager” window.
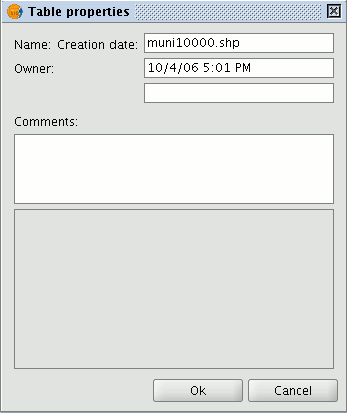
You can use this window to:
- Rename the table.
- Edit the creation date.
- Add an owner to the table.
- Add comments.
When you have input the changes, click on “Ok” and they will be saved.
Table tools
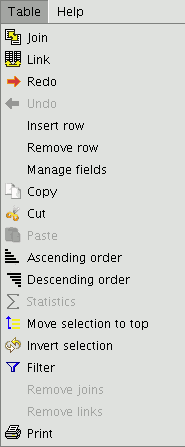
When a table has been loaded, either from the “Project manager” or from the view, the tools associated with the table will appear in the tool bar.

A new menu, called “Table”, will also be activated in the tool bar. This can also be used to access the different tools.
You can access this option by clicking on the following button

or by going to the “Table” menu and then to “Statistics”.
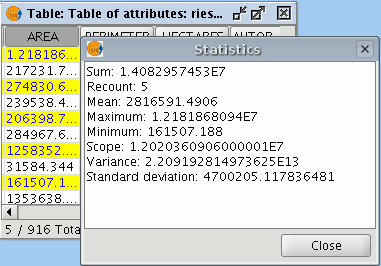
The “Statistics” tool allows you to obtain the most common statistical values.
N.B.: Remember that the tool will not be activated until you select a numerical field.
If you wish to obtain field statistics, select the field (left click on the field heading), then click on the “Statistics” tool.
You can only obtain statistics from a series of records, firstly, select the field the values are located in, then select the desired records, and click on the “Statistics” tool.
You can access this tool by clicking on the “Filter” button in the tool bar

or by going to the “Table” menu and then to “Filter”. The “Filter” tool works in much the same way as in the “Views” section.
gvSIG allows selections to be made using filters. Selection using filters allows you to define exactly what you want to select, including several attributes, operators and calculations.
Requests can be made using logical operators, such as “equals” “more than” “different from”, etc.
If you press the “Filter” button in the tool bar, a dialogue window will appear to define your request.

Fields: Double click on the field you wish to add to your request from the “Fields” list in the layer.
Logical operators: These allow you to insert a logical expression into your query by clicking on them.
Values: This shows a list with the different values the selected field has. If you wish to add a value to the request, double click on it.
Request: This is the window which represents the request to be made. You can write here directly.
Selection buttons: These buttons make the request using:
- “New set” (deletes any previous selections).
- “Add to set” (adds the elements selected by the query to the existing elements).
- “Select from set” (makes the request from the selected elements).
N.B.: In a gvSIG view, when you activate a layer by selecting it in the ToC, the filter tool will also be activated in the tool bar, even though no table has been loaded. This allows you to work with the table associated with the selected layer. The "Table" menu will also be added in the menu bar. This provides another way to access the filter tool when it drops down.
You can access this tool by clicking on the following tool bar button

or by going to the “Table” menu and then to “Ascending order”.
The “Ascending order” tool allows you to order the table records.
- It orders the values from the lowest to the highest in a numerical field.
- It orders the records in alphabetical order, starting from “A” in a text field.
You can access this tool by clicking on the following tool bar button

or by going to the “Table” menu and then to “Descending order”. The “Descending order” tool allows you to order the table records. It orders the values from the highest to the lowest in a numerical field. It orders the records in alphabetical order, starting from “Z” in a text field.
The “Join” tool allows two tables to be joined via a common field. You can also access this tool by clicking on the following button

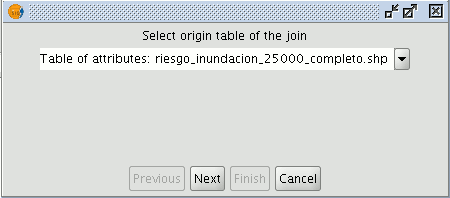
or by going to the “Table” menu and then to “Join”. To join the two tables, carry out the following steps: Firstly, specify the source table the join is to be made from.
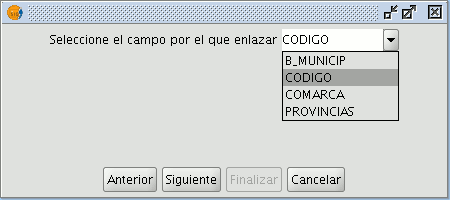
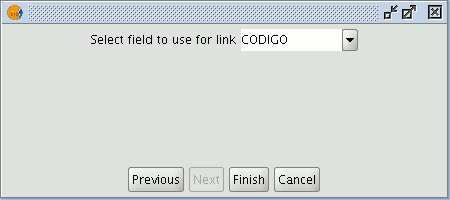
Then specify the field to be used for the join.
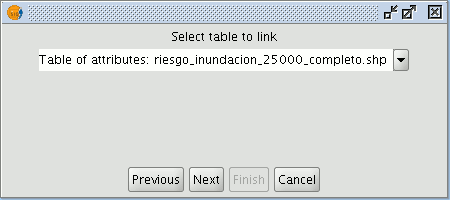
Then indicate the table you wish to join to the first one.
Finally, indicate the field in the second table which is common to the first one.
If you open the data source table, you will see that the fields of the destination table have been joined. The name of the field added to the table is identified by the word “Join_(Field name)”
This tool allows the records selected in the table to be moved to the top of the table. You can access this tool by clicking on the following button in the tool bar

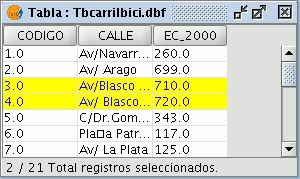
or by going to the “Table” menu and then to “Move selection to top”. The following table shows an example in which two records have been selected to move to the top of the table.
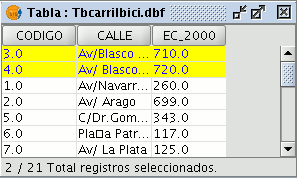
If you click on the button, the table will change the position of the selected records.
Although .dbf files should contain a byte to indicate character encoding, this information is usually not present. gvSIG provides the Shalom tool that sets the encoding and then reads the information in the table using that encoding. If the encoding is not set in this way then gvSIG will read the table data using the default encoding.
It is possible to set the character encoding of a table by selecting Table > Set encoding to .dbf files from the menu bar. Choose the table for which the encoding needs to be set and then select the encoding type (charset). This encoding setting is recorded permanently in the table.
Now the table can be added to the gvSIG project. When gvSIG opens the table the character encoding is read and the characters in the table are correctly displayed.
Note: The correct display of characters depends not only on the encoding setting, but also on the virtual machine that is installed (specifically Java 1.6, which supports more encodings than Java 1.5).
This option can be accessed by opening the Window > Preferences menu and then selecting DBF default encoding.
gvSIG will use the selected encoding as the default when adding a .dbf file to a project, and will also use it when exporting a table that uses a specific encoding.
The export of a table might not be correct if the character encoding is incorrectly configured in the gvSIG preferences.
Adding a table from a CSV file
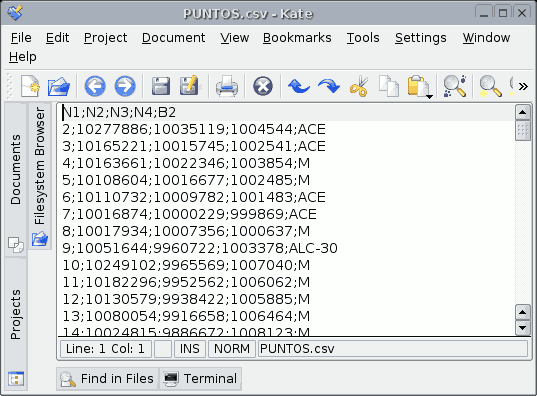
From version 0.5 onwards, gvSIG can read information contained in a plain text file, whose fields are separated by a semi-colon.
To carry out this operation, go firstly to the “Project manager”. Select “Tables” and then click on “New”. A search dialogue box will open. Click on “Add” and the file browser will appear in a new window (select “csv string” in “Type of file” to show the csv files).
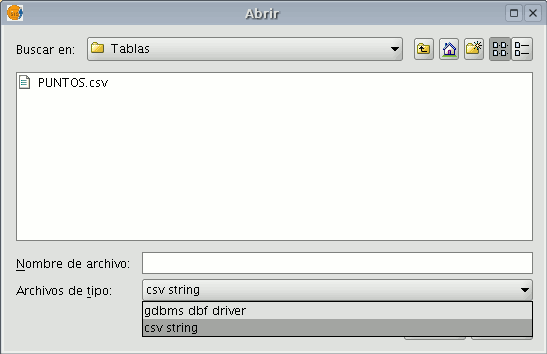
When the .csv file has been selected, click on “Open”.
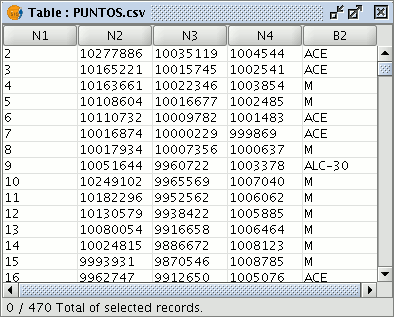
If you click on “Ok”, the data of the table you have added will be shown.
Adding a table from a JDBC data origin
The contents of a data base table can be imported to gvSIG using data base managers (PostgreSQL, MySQL, GBMS-HSQLDB, ODBC). gvSIG processes the information obtained just like any other table.
Note: Oracle drivers installation is required for access to Oracle Spatial databases of the geoBD extension. Please follow the steps bellow: Go to Oracle Database 10g Release 2 (10.2.0.3) drivers.
Accept the license terms. In the next page, download the file ojdbc14.jar (1,545,954 bytes) - classes for use with JDK 1.4 and 1.5. (Registration required)
Move this file to the next folder:
- Windows:
Move the file to the:
bin\gvSIG\extensiones\com.iver.cit.gvsig\lib
folder, that is in the directory where gvSIG is installed.
- Linux:
Move the file to the:
bin/gvSIG/extensiones/com.iver.cit.gvsig/lib folder
, that is in the directory where gvSIG is installed.
To load a table with the information obtained from a JDBC data origin you must:
Firstly, go to the "Project manager" and select "Tables". Then click on "New". Select the “Data base” tab in the window that opens (“New table”) and configure the data base server connection parameters:
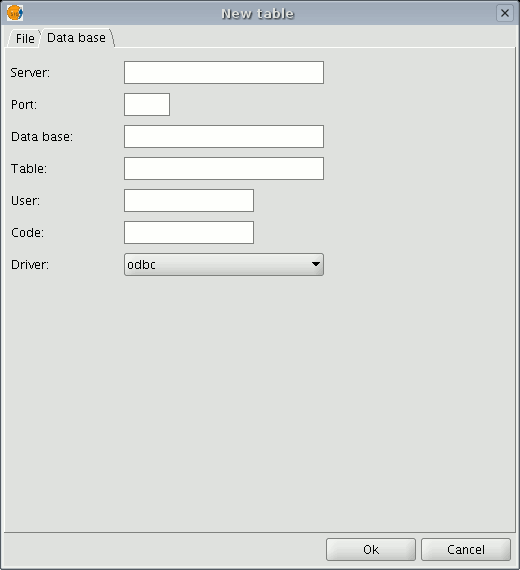
If the information entered is correct, a new table will be created in gvSIG with the information contained in the original JDBC table.


